
DamageMap: A Post-Wildfire Damaged Building Detector
Published:

DamageMap is a system composed of rapid buildings damage assessment and a convenient user interface for result visualization. It uses AI to identify damaged buildings after wildfires using aerial surveys uploaded by users.
DamageMap automates the laborious structure damage inspection process, which is currently performed manually. With a variety of features, including real-time damage assessment and damage report generation, DamageMap can help fasten the post-wildfire recovery and assist those affected by wildfires, including first responders and policy makers.
How can you use DamageMap?
Click here to try out DamageMap yourself! (allow few seconds to load)
On the user interface of DamageMap, first responders or local agencies can upload post-fire aerial images through the upload link and publish it to the general public. Then users can view the damage prediction for each detected structure in the similar way of using Google Map. On top of the webpage, there’s also a search bar for residents to type in their addresses to zoom in to their area of interests. On the page, you can also see some statistics that we are able to generate using the prediction and local data.
For first responders:
DamageMap provides real-time structure damage assessments once the aerial images are available. With the 96% of accuracy, this information can help first responders to better allocate human resources during the immediate post-fire phase.
For residents:
Our online visualization of structural damages provides individuals with information of the status of their properties. Evacuees and others who wanted to see the status of their properties, can easily check the high-resolution aerial images using their addresses. The specifically designed screenshot download link can provide evacuees with proof of their property status and ideally, help them start their insurance claims process as soon as possible.
For policy-makers or researchers:
With our damage detection model, we are also able to generate basic statistics, including the estimation of total loss and the statistics of those who are most vulnerable. Such information can be extremely helpful for policy-makers of all levels of governments or researchers in academia to better understand the social justice and equality issues of wildland fires and better organize disaster relief and recovery resources for the local residents.
What inspired us to create DamageMap?
With climate changes and other anthropogenic factors, such as the increase of occupancy in the wildland-urban interface (WUI) and the aging of the electricity system, wildfires have become more frequent and destructive in places like California. According to CALFIRE, in 2017, California experienced a 12% increase in the number of fires and a 76% increase in acres burned from 2016.
Along with the increasing wildfire frequency and magnitude, the number of structures destroyed also increased drastically. In 2017, 10,868 structures were burned down during wildfire, which surpasses any previous records. Meanwhile, the current post-fire identification of destroyed structures rely on manual inspections. During the 2018 Camp Fire, some 60 teams of inspectors were deployed to perform inspections for more than 19,000 structures. As one can imagine, this process is both time-consuming and labor intensive.

Since post-wildfire disaster relief is heavily dependent on rapid damage detection, we decided to create a tool that can automatically detect damaged structures using high resolution drone imagery and deep learning. With this automated technique, we hope to facilitate first responders and local agencies better plan their rehabilitation efforts and help fire victims jump-start their recovery journey.
How does DamageMap work?
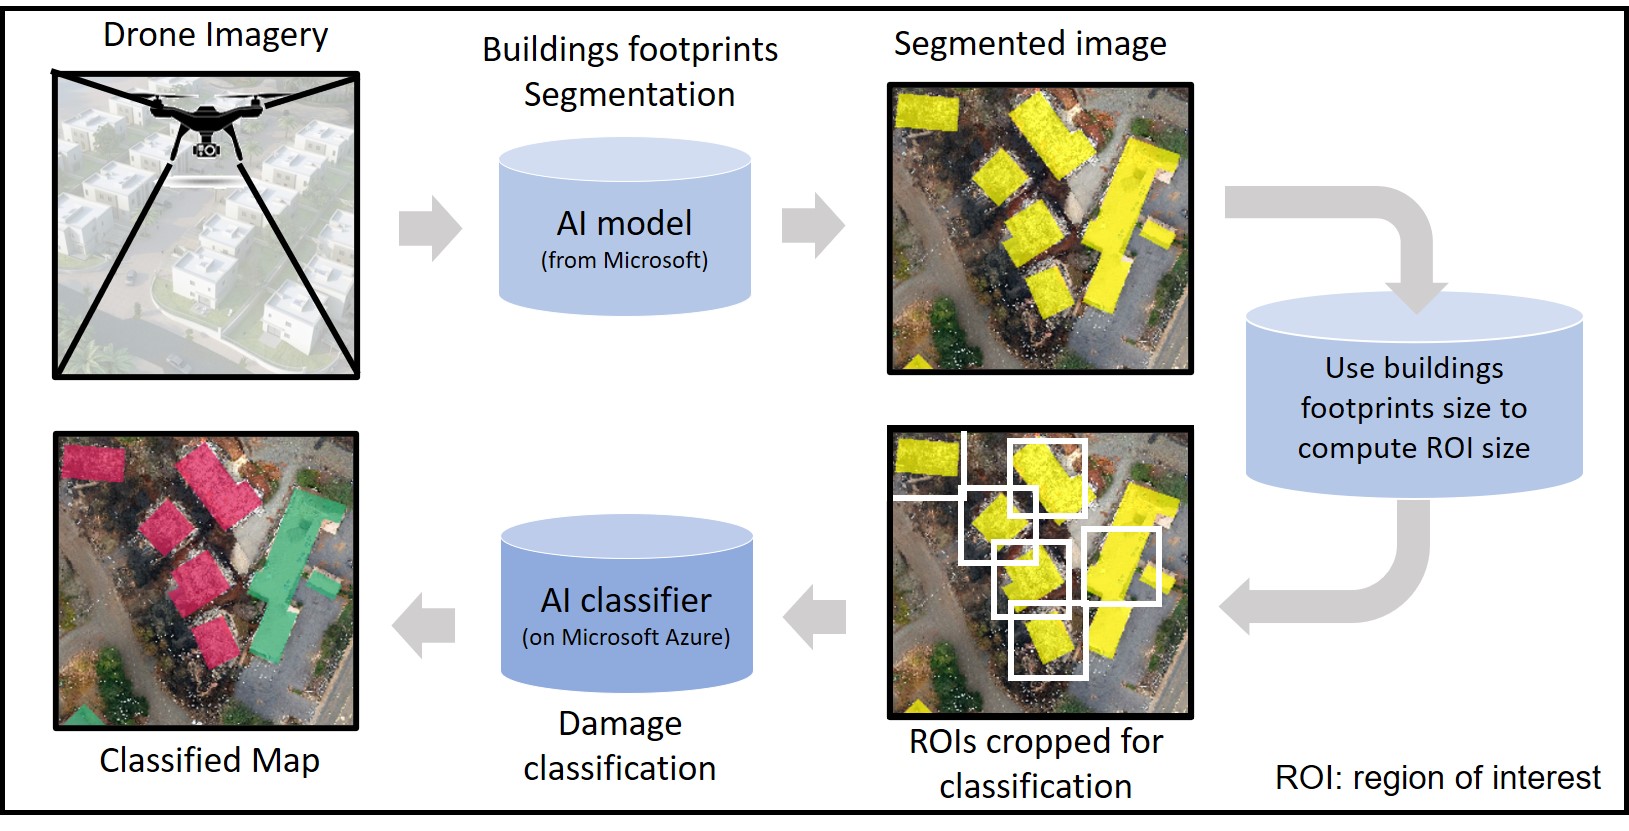
DamageMap does the following when a new user uploads an aerial survey:
Ingest aerial survey: DamageMap accepts input aerial survey in GeoTiff Format through a dedicated Google Drive. When user uploads imagery (preferably sub-30cm resolution), DamageMap ingests and stores it in the required format for running the model.
Segmentation: In this step, DamageMap uses a pre-trained ResNet34 model from Microsoft (US Building Footprints) to segment all structures in a landscape.
Cropping: Once all structures are segmented, square scenes centering the structure are cropped from the landscape. Here, the size of the square is determined by the average building size in scene.
Classification: The cropped images are then classified as “damaged building” or “not damaged building” using Microsoft Azure’s VM. For our classification model we performed transfer learning using Pytorch. More specifically, we used a ResNet18 network architecture pre-trained on Imagenet. Then, we fine tuned the model using a stochastic gradient descent with Nesterov momentum optimizer and cross entropy loss function for a total of 50 epochs. For fine tuning, we used the pre-labeled dataset of Paradise City, California after the 2018 Camp Fire.
Reconstruction: After classifying each cropped image, DamageMap transposes the images from pixel-space to geospace (lat-lon) by remapping the cropped images onto the original landscape scene.
Visualization: The web-app is updated with the new aerial survey and with damaged and safe buildings overlaid.
The whole process takes ~20 mins for a 50 km² area. Scripts for executing the above process (along with training steps for our model) can be found here.
Model’s Robustness
DamageMap in operation
We have taken care to make the model generalizable to most wildland urban interfaces. The model provides a 99.4% detection accuracy for the whole U.S. and a 96% classification accuracy on the validation datasets (out-of-sample) collected from Cal Fire. We would expect the classification performance to demonstrate a slight drop if the model is used on a new image taken from a different camera in an area with very different landscape and architecture. However, every time the model sees a new image it will automatically use it to increase its future performance on new different cases. So, if people start to use the model, any bias issue will be eliminated soon.
Socio-economic Assessments and Impacts
Wildfires do not discriminate–they can destroy multi-million dollar mansions and trailer parks with the same blaze. However, the post-wildfire rebuilding and recovery heavily depends on the socio-economic status of those who were affected.
For many low-income households and those are below the poverty line, house insurance in high fire-risk zones has been increasingly unaffordable after catastrophic wildfires, creating huge burden for recovery and likely causing people to become homeless. Take Paradise City as an example, the situation is even worse as 25% of the population is the elderly who has limited income.
Besides socio-economic status, race, ethnicity, and immigration status can also make people more vulnerable to wildfires. After the two devastating wildland fires in Sonoma County in 2017, many of the low-wage workers were undocumented so they were not qualified for the assistance from FEMA. What made the situation worse was that they had to leave the area to restart. Many times, immigrants were also uncomfortable showing up to evacuation centers or accepting the help from governments due to the barriers of language and the extra concerns resulting from their immigration status.
With all the chaos during the aftermath of wildfires, having a clear big picture of the impacted population is the key to establishing efficient rebuilding efforts that support the most vulnerable and underrepresented people. With this aspect in mind, we designed DamageMap with features capable of providing insights about the affected and underrepresented population to ensure social justice and equality in the process of rebuilding and recovery from wildland fires.
By using the results of damage assessment together with data from Census, DamageMap is able to calculate the percentage of damaged structures belonging to a certain vulnerable population group with the granularity of a single neighborhood, which is more detailed than a zip code region. For example, in the case of Paradise City, our DamageMap platform shows that 26% of the damaged structures belong to the elderly (above 65 years old).
With these rapid socio-economic assessment and estimation regarding the vulnerable population, we hope to help all levels of agencies and NGOs better plan and allocate disaster relief resources to support those in need, especially the underrepresented groups in disaster response and recovery.
What’s next for DamageMap?
As a team, we would like to continue developing DamageMap as an open-source platform considering that this project can truly benefit multiple stakeholders who are affected by the devastating wildfires. Some of our plans include the followings:
- Cross validate with multiple wildfire cases and different roof architectures
- Reach out to first responders and policy makers to test and iterate DamageMap
- Use data driven approaches to augment training examples to improve detection accuracy on validation sets
- Tune model to work on any image resolutions
- Use data science tools to perform multi-class instead of binary classification to evaluate percentage of damage for structures
We would like to thank:
We thank Dr. Andrew Fricker (California Polytechnic State University) for providing us access to various datasets. We thank Santa Rosa Deputy Fire Chief, Scott Westrope, and the Santa Rosa Fire Department for providing us with insights of first responders. We thank Stace Maples for guidance on reverse geocoding. We thank all mentors of the Big Earth Hackathon for providing valuable advice and suggestions.